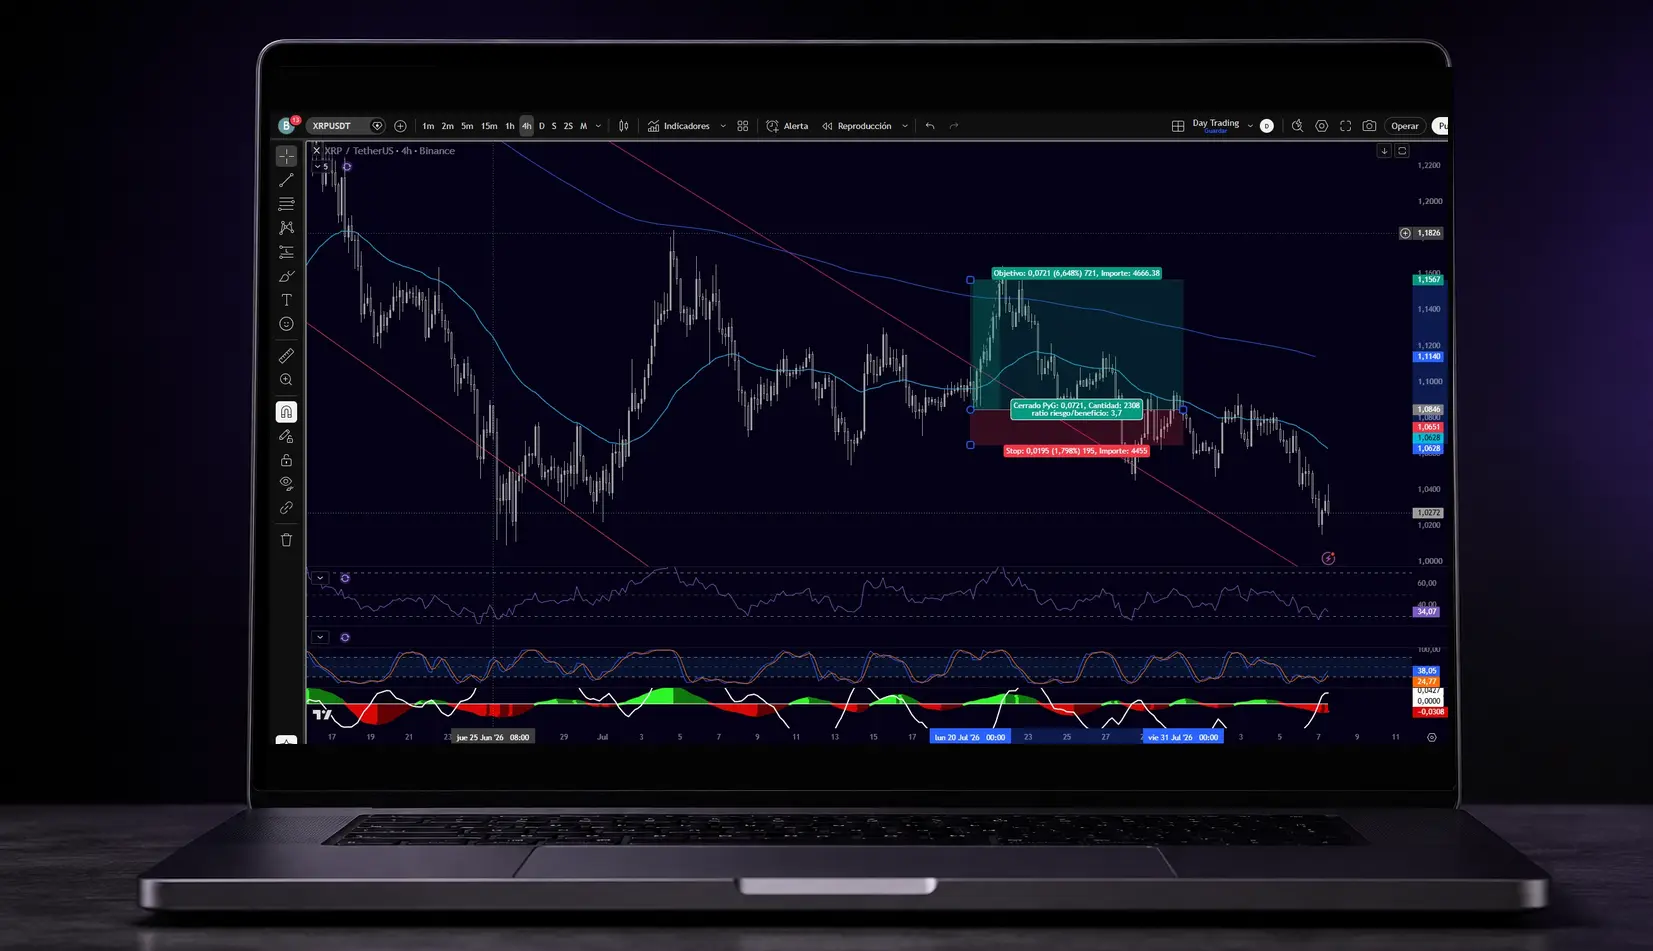
A risk-reward ratio compares how much you are prepared to lose with how much you expect to gain if a trade reaches its target. The arithmetic is simple. The difficult part is not using it to justify a trade you had already decided to take. An attractive ratio does not make a trade good. The target may be unrealistic, the stop may be too close, or your strategy's win rate may not support that relationship. The ratio is a useful pre-trade filter, but it needs context and a sample of real trades.
The ratio does not predict the outcome. It makes you define the risk before accepting the potential reward.
What a 1:2 risk-reward ratio means
This article uses risk:reward notation. A 1:2 ratio means risking one unit to seek two units of reward. If you risk $50, the potential target would be $100. If your platform divides reward by risk, the result will be 2.
Both conventions appear across platforms and educational material. Always check the order before comparing numbers. A 2:1 label may describe the same relationship when reward is written first.
The currency is not the key point. You can measure a trade in dollars, euros, USDT, points or R units. If 1R represents your initial risk, closing at +2R means gaining twice that amount; −1R represents the full planned loss.
How to calculate the ratio step by step
You need three prices before entering:
For a long trade:
Risk = entry − stop Potential reward = target − entry Reward/risk ratio = potential reward ÷ risk
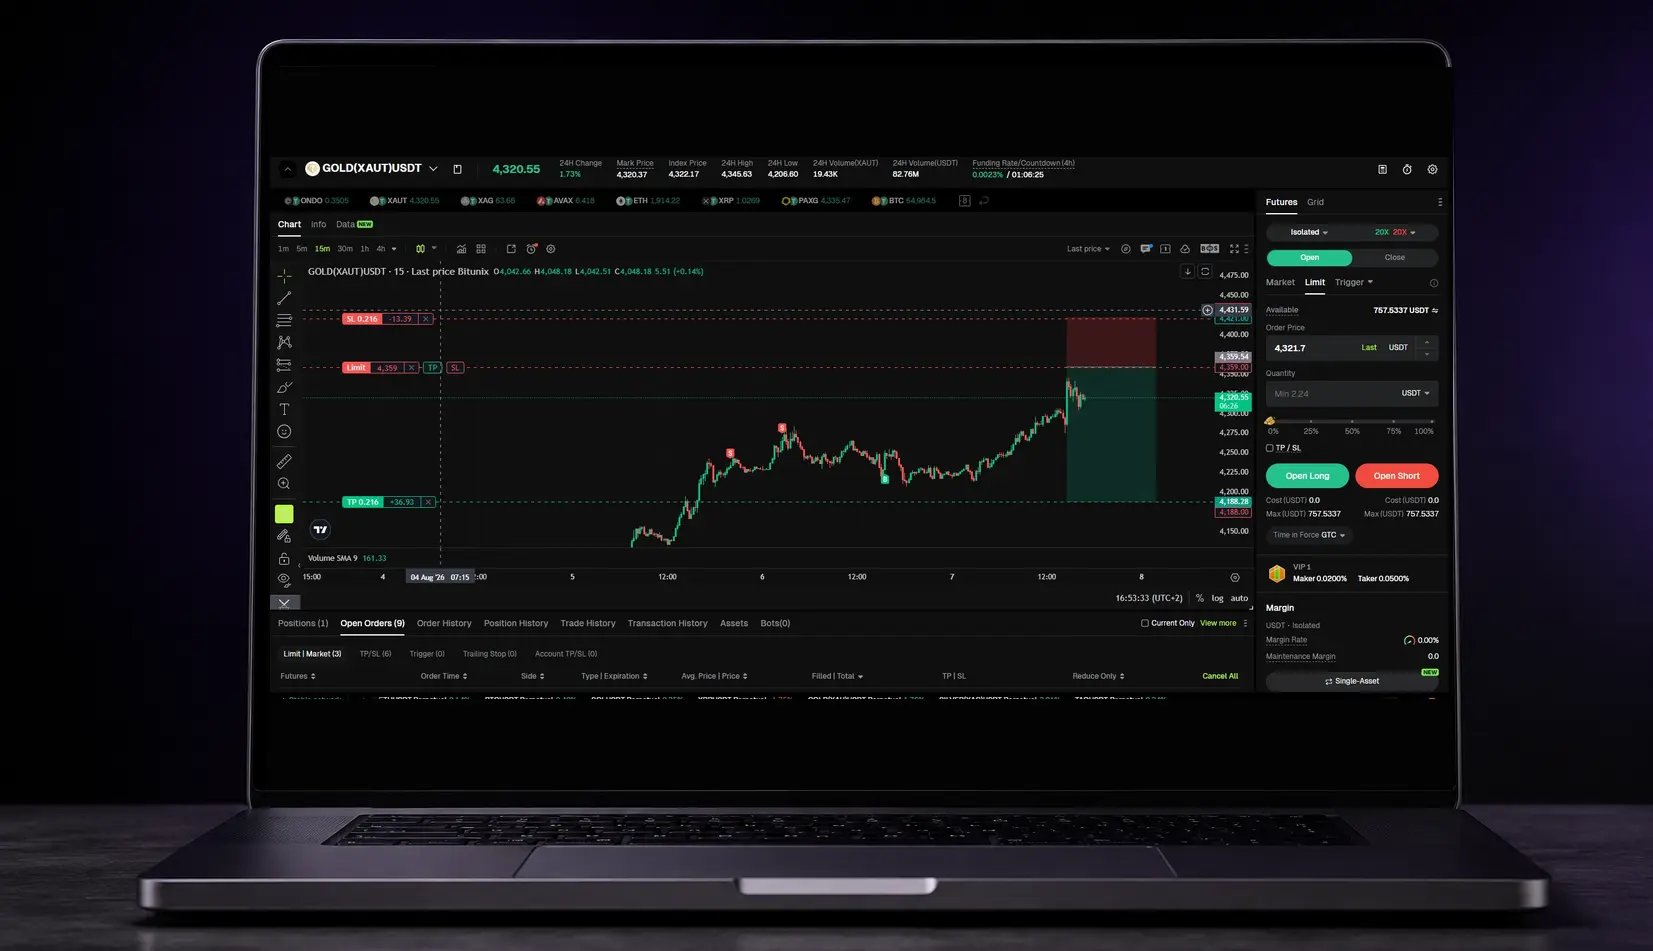
Suppose the entry is 100, the stop is 98 and the target is 104. The risk per unit is 2 and the potential reward is 4. That is a 1:2 risk-reward relationship.
This calculation compares price distances; it does not decide how much capital to expose. For that, calculate your position size from your maximum permitted loss. A trade can offer 1:2 and still carry excessive risk when its position is too large.
- Entry: the planned opening price.
- Stop or invalidation: where you accept that the idea no longer works.
- Target: where you plan to take the profit.
- Entry: 100
- Stop: 98
- Target: 104
- Risk per unit: 2
- Potential reward: 4
Planned and realised ratios are not the same
The planned ratio uses your initial entry, stop and target. The realised result uses actual exits and costs. Partial exits, stop adjustments, fees, funding and slippage can all create a difference.
A trade planned at 1:2 may finish at +0.8R because you exited early. It may lose slightly more than 1R when a stop is filled at a worse price during a fast move. Stop orders help manage risk, but the trigger does not guarantee the final execution price.
Keep both sides in your trading journal:
The difference is not always an error. An early exit may follow a valid rule. It becomes a concern when the exception repeats and loss aversion consistently cuts winners or expands losses.
- planned ratio before entry;
- final result in R;
- trading costs;
- reason for any exit outside the plan.
Is a 1:2 ratio always good?
No. The relationship must fit your strategy's win rate and logic. If you push the target farther away to create a prettier ratio, price may reach it less often. If you move the stop too close, normal market noise may close more trades.
The break-even win rate can be estimated and tested in a backtest without seeing future candles:
Minimum win rate = 1 ÷ (1 + reward per unit of risk)
\*Before commissions, funding and slippage.
With an average 1:2 ratio, winning more than one third of trades would exceed the theoretical break-even point. But the useful number is not what you write before trading. It is the combination of your average win, average loss and actual win rate across comparable trades.
A system winning 60% with an average gain of 0.8R may outperform one that promises 3R but rarely reaches the target. The highest ratio does not win automatically. Probability gets a vote too.
- 1:1: 50%
- 1:1.5: 40%
- 1:2: 33.3%
- 1:3: 25%
Three mistakes that make the ratio lie
Placing the stop to make the numbers work. Invalidation should show where the thesis stops making sense. Set it first and calculate position size afterwards. Moving a stop closer just to display 1:3 changes the technical risk and may turn routine movement into a loss.
Choosing a target without realistic room. A target needs a reason: market structure, a level, volatility or an exit rule. Typing a distant number improves the ratio on paper, not the probability of reaching it.
Reviewing winners only. If you study only trades that reached their targets, you remove the cases that determine win rate. Compare trades from the same setup, market and context. A small sample describes what happened; it does not yet establish what to expect.
These mistakes often appear early. The guide to beginner trading mistakes helps identify when urgency has replaced process.
How to use the ratio in your plan
Your trading plan should explain how you set entries, invalidations and targets, which minimum ratio each setup accepts, and when a trade must be rejected. It does not need to impose one number on every strategy.
Before entering, ask four questions:
1. Does the stop invalidate the idea, or merely improve the ratio? 2. Is there realistic room for the target in the current context? 3. Does position size respect my maximum loss? 4. Does the relationship fit this setup's historical data?
Then record both the planned and realised ratio. During your weekly review, group comparable trades and check whether you cut winners early, widen losses or choose targets your process rarely completes.
TRAZZA brings the calculator, journal and analytics together so that planned risk does not remain disconnected from actual execution. Its method does not label a trade good or bad from one outcome; it turns a series of decisions into evidence you can review.
What to remember
The risk-reward ratio is a filter, not a guarantee. It estimates what you may lose and gain, but it does not measure setup quality or probability on its own.
Define invalidation and target first. Adjust position size afterwards. Record the planned ratio, compare it with the realised result and review it alongside your win rate. A number then stops acting like a promise and becomes a verifiable part of your process.
Review checklist
- ✓The stop invalidates the idea and is not placed merely to improve the ratio.
- ✓The target has realistic room in the current context.
- ✓Position size respects the permitted maximum loss.
- ✓I will record planned ratio, result in R and actual costs.
Frequently asked questions
How do you calculate the risk-reward ratio in trading?+
Calculate the distance from entry to stop and compare it with the distance from entry to target. If you risk 2 to seek 4, the risk:reward ratio is 1:2.
What is a good risk-reward ratio?+
There is no universal value. It must fit the strategy, win rate, costs and market context. A high ratio with very few winning trades may produce worse results than a more modest, repeatable one.
What win rate does a 1:2 ratio require?+
Before costs, the theoretical break-even point is about 33.3%. In practice you need an additional margin for fees, funding, slippage and differences between planning and execution.
Are risk-reward ratio and position size the same thing?+
No. The ratio compares potential loss and reward. Position size determines how much capital you expose based on stop distance and your risk limit.