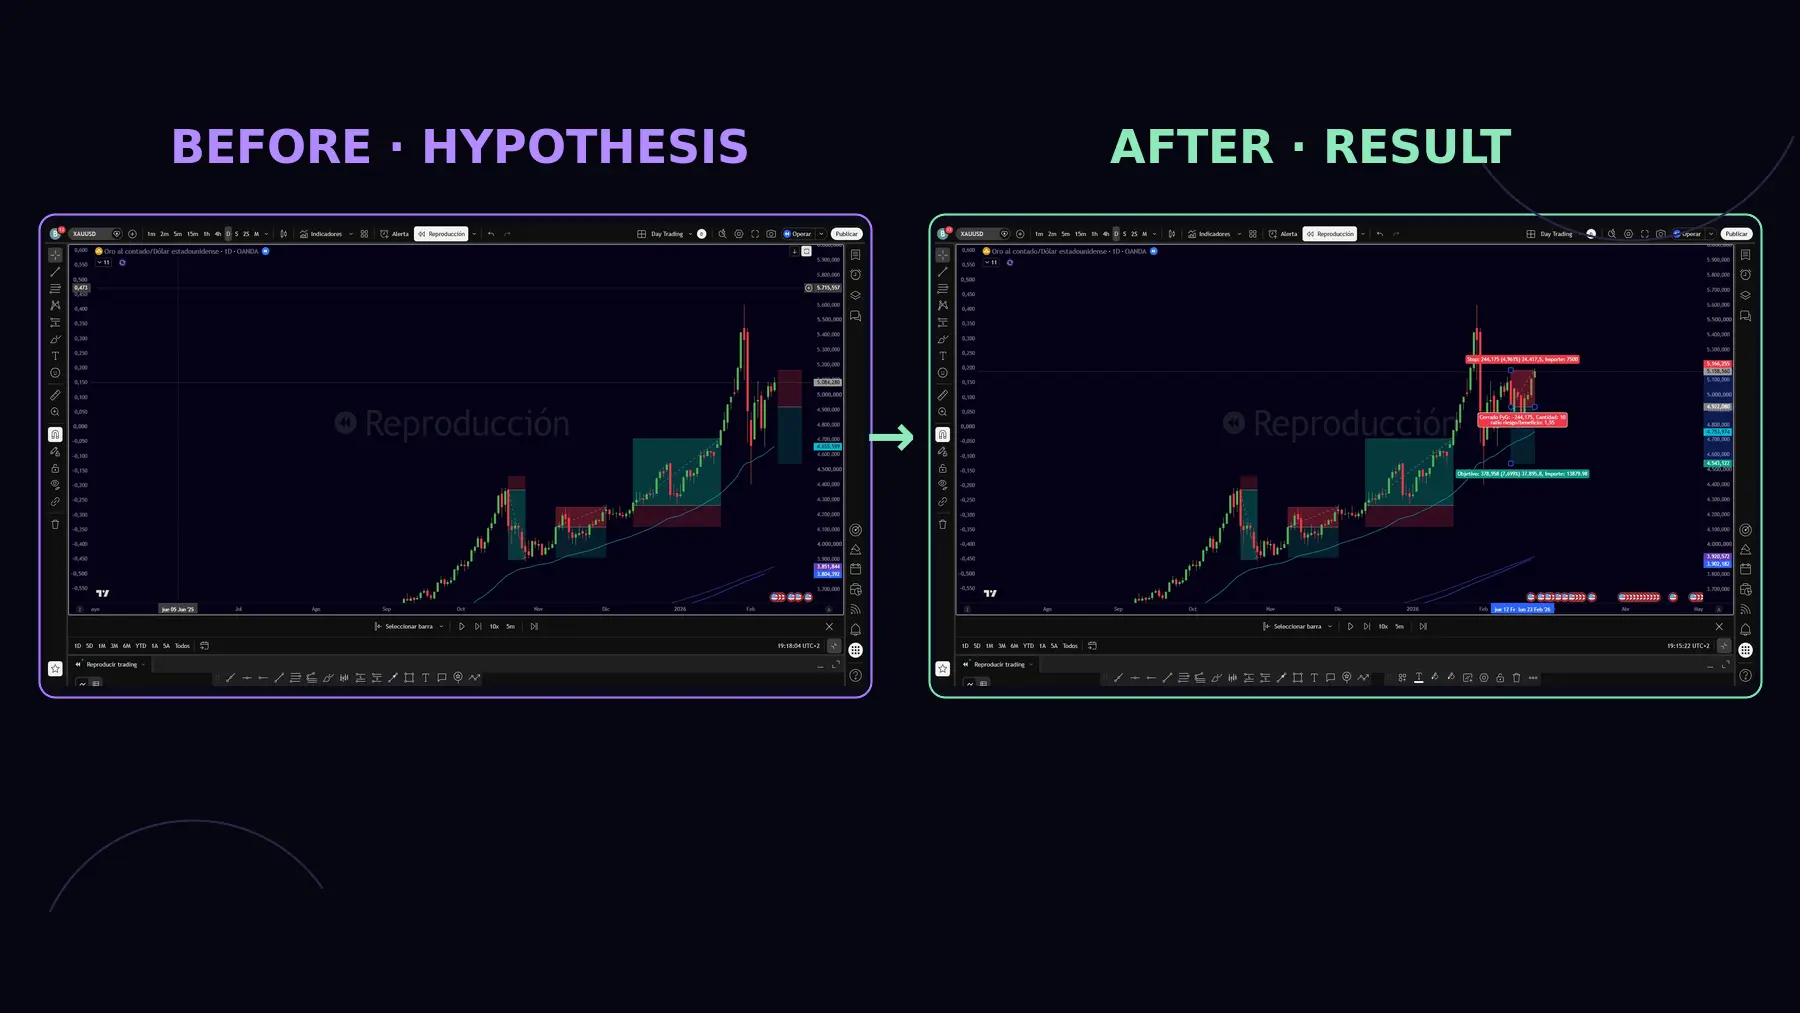
A strategy can look flawless after the market has moved. Entries seem obvious and each stop appears perfectly placed. In real time, opportunities do not arrive with circles drawn around them. Backtesting reduces that illusion by applying predefined rules to historical data. It cannot prove what will happen tomorrow, but it can show whether an idea deserves further testing.
A useful backtest does not try to prove you right. It tries to find where you could be wrong.
What is trading backtesting?
A backtest is a simulation of a strategy using past market data. You review a historical period, identify every occasion that meets your rules and record the entry, invalidation, exit, risk, costs and result.
It can be performed manually, one candle at a time, or automatically with coded rules. The question remains: if I had followed these rules without knowing the future, what might have happened? The result is still hypothetical and does not replace demo testing, real-time observation or risk management.
Turn the idea into rules before you begin
You cannot reliably test “buy when the market looks strong.” A testable strategy needs conditions that cannot be reinterpreted after the outcome.
Define these points before opening the historical data:
If those decisions are missing, start by building a trading plan. A backtest cannot repair an ambiguous idea; it can only produce a very busy spreadsheet.
- market, instrument and timeframe;
- exact entry conditions;
- invalidation point and stop;
- target or exit rule;
- risk per trade and position size;
- permitted days and hours;
- costs included in the test;
- conditions that cancel the setup.
Choose a period without choosing the outcome
Select a period covering trends, ranges and different levels of volatility. Write down the dates before inspecting the results. If you compare variants, reserve some data to test the chosen version later. This out-of-sample period helps reveal rules that fit only the design data.
Move forward without seeing future candles
For a manual test, use replay or hide the right side of the chart. Decide only with information available at that time. Automated tests can also leak future data if an indicator uses values that did not yet exist on the evaluated candle. Such a result cannot be reproduced live.
The basic tools for a manual test are chart replay and a spreadsheet that preserves every signal. If the rules are objective and can be coded, a script or backtesting engine can review more cases, but it cannot repair ambiguous rules or poor data. TRAZZA does not replace the simulator: it organises the evidence so the historical result can later be compared with live execution.
Record every valid signal
If a trade meets the predefined rules, it belongs in the sample. Removing losses after seeing them turns backtesting into a collection of pleasant memories.
Use a simple table:
This resembles a trading journal, but simulated tests and actual trades should remain clearly separated.
- Context — Date, instrument, session and timeframe
- Signal — Setup and conditions that triggered the entry
- Plan — Entry, stop, target and planned risk
- Simulated execution — Entry and exit based on one consistent rule
- Costs — Commission, spread, funding and estimated slippage
- Result — Net result in money, percentage or R multiples
- Evidence — Screenshot and a brief note without rewriting the rules
Include costs and realistic execution
Include commissions, spread, financing or funding and a prudent slippage estimate. A stop may fill at a different price in fast markets, while a limit order may not fill at all. Avoid precision that real execution cannot provide.
Review more than total profit
A positive final result says little on its own. Review at least:
No universal trade count validates every strategy. The sample needs repetitions and varied conditions. A setup that appears four times a year requires a longer period than one occurring several times a week.
- number of trades;
- win rate;
- average win and average loss;
- planned and realised risk-reward ratio;
- expectancy per trade;
- maximum drawdown;
- losing streaks;
- results by context, instrument or session.
A simple example
Imagine a strategy with 40 simulated trades. It wins 18 and loses 22. Its average win is 1.6R and its average loss is −1R.
Approximate expectancy would be:
(45% × 1.6R) − (55% × 1R) = 0.17R per trade
The result is positive, but it does not settle the matter. Ask:
Statistics do not remove uncertainty. They make the conversation with it slightly less improvised.
- Were fees and slippage included?
- Do two exceptional winners explain most of the result?
- Would the drawdown be tolerable?
- Does it work across more than one market condition?
- Do the rules survive the reserved period?
Mistakes that make a backtest look better than it is
Looking ahead. Using future information, deliberately or accidentally, lets the strategy play with marked cards.
Fitting the past until it looks perfect. Changing filters, hours and parameters after each loss may create a strategy that memorises one period and fails in the next. This is overfitting.
Keeping only what works. Testing many instruments or variations and presenting only the best one hides how many attempts failed.
Ignoring costs and liquidity. The smaller the edge and the higher the frequency, the more damaging this omission becomes.
Changing rules during the test. Record an interesting improvement as a new hypothesis and test it again from the beginning. Do not introduce it halfway through the sample.
Confusing simulation with execution skill. A rule may work on paper and be difficult to follow under pressure. That gap needs to be measured, not assumed away.
A backtest creates a hypothesis. Actual execution, costs and decisions reveal how much of it survives outside historical data.
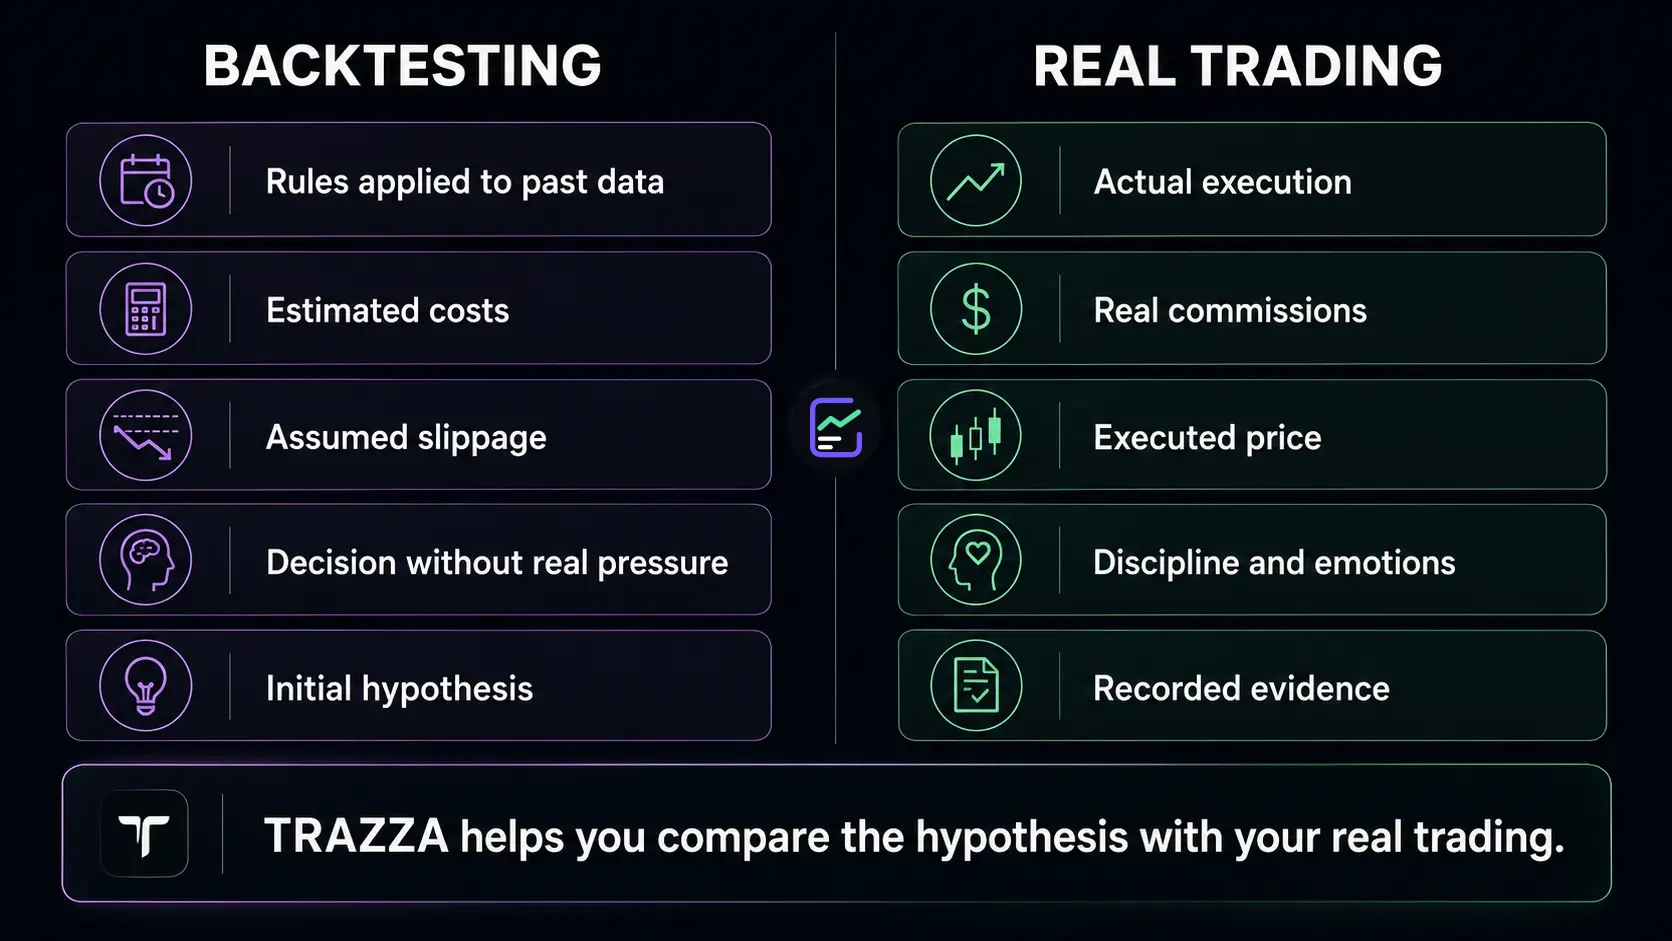
From backtest to actual trading
When a hypothesis survives historical testing, the next step does not have to be more risk. Move it to a demo account or a controlled environment, record signals in real time and compare:
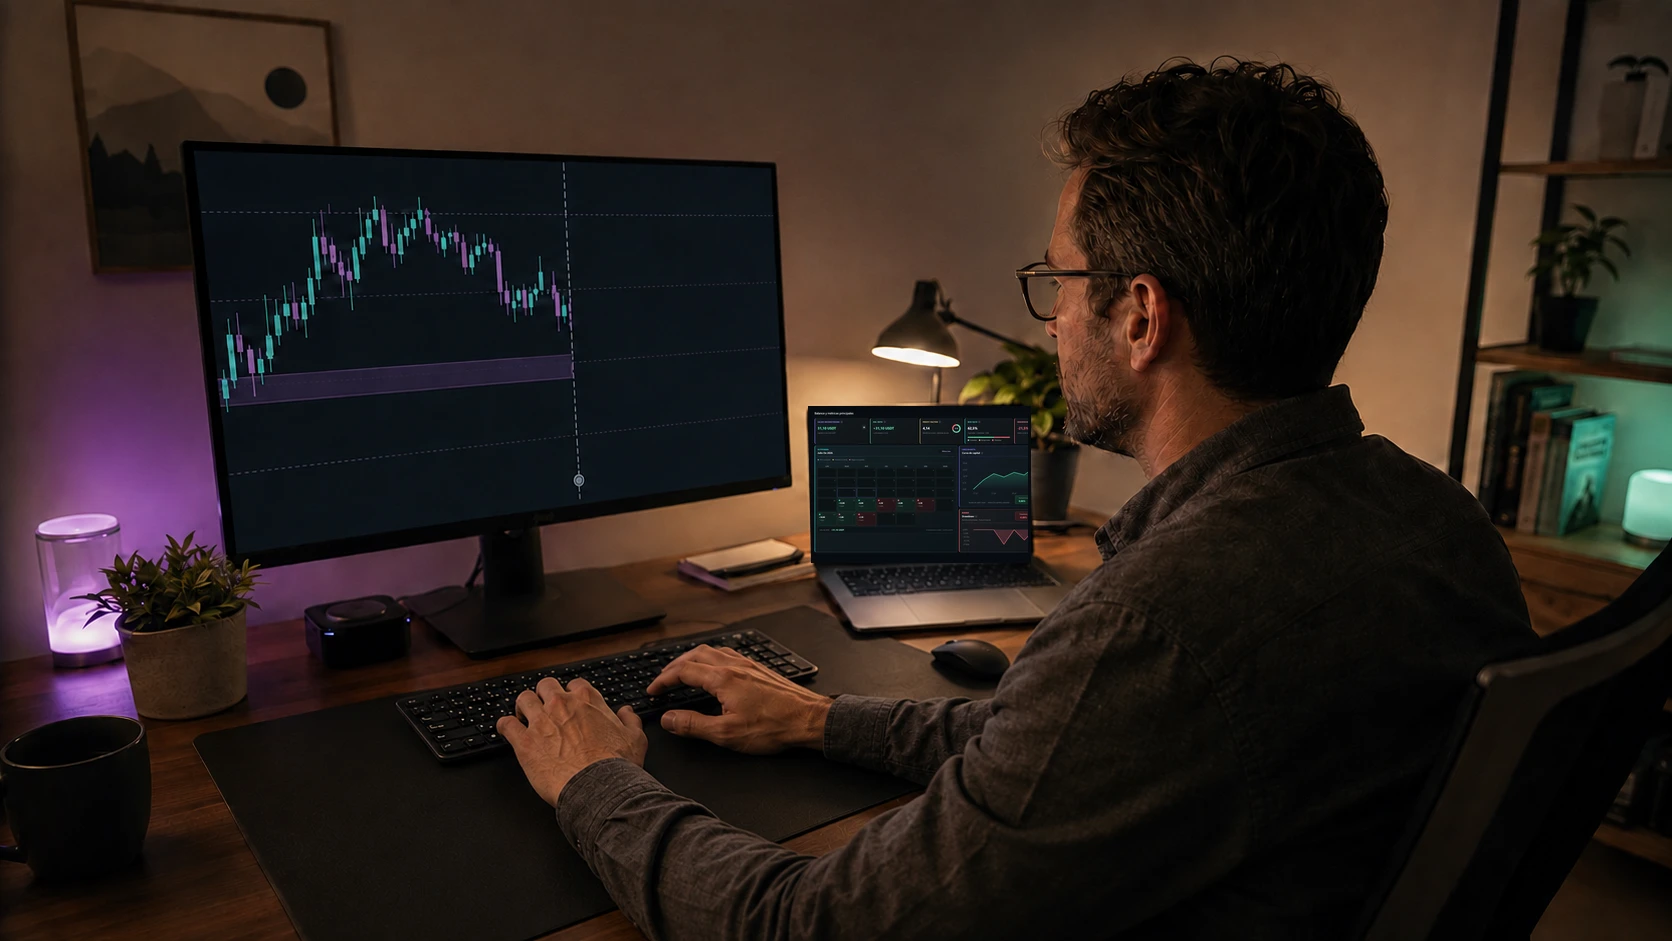
Historical testing creates a hypothesis; the TRAZZA dashboard later brings together evidence from actual trading. The laptop screen uses an authentic capture from the QA environment.
TRAZZA brings trades, costs, risk, context and statistics together to help you analyse actual trading. It does not turn a backtest into a promise or execute the strategy for you. It helps you examine what happened when the hypothesis left the historical chart and met your decisions.
That comparison fits TRAZZA’s record, contextualise, discover, act and evolve process. It also reflects one of the TRAZZA Method principles: evidence before intuition. If real behaviour differs from the simulation, that difference is not an inconvenient detail. It may be the most useful finding in the entire test.
- expected and observed frequency;
- theoretical entry and achievable execution;
- estimated and actual costs;
- simulated and experienced drawdown;
- written rules and decisions actually taken.
Write a conclusion that can be tested
The purpose of backtesting is not to produce an attractive equity curve. It is to finish with a limited, verifiable conclusion:
That is more honest than claiming a strategy “works,” and far more useful. Keep the rules, separate simulated and actual results, and examine the difference without moving the goalposts after every trade.
When each trade is documented, the past stops being a showroom and starts becoming evidence. Request access to TRAZZA if you want to analyse your actual trading with that approach.
Frequently asked questions
What does backtesting mean in trading?+
It means applying trading rules to historical data to estimate how they might have behaved. The results are simulated and do not guarantee future performance.
Is manual or automated backtesting better?+
Manual testing helps traders understand visual logic and decisions. Automated testing can process more data with coded rules. Both can contain bias and require criteria defined in advance.
How many trades do I need for a backtest?+
There is no single number for every strategy. The sample needs enough signals and different conditions to answer the question being tested. Less frequent setups usually require a longer historical period.
Can I trade immediately after a good backtest?+
A strong historical result remains hypothetical. Test the strategy on unseen data and then in demo or with controlled exposure, including real costs, execution and rule adherence.