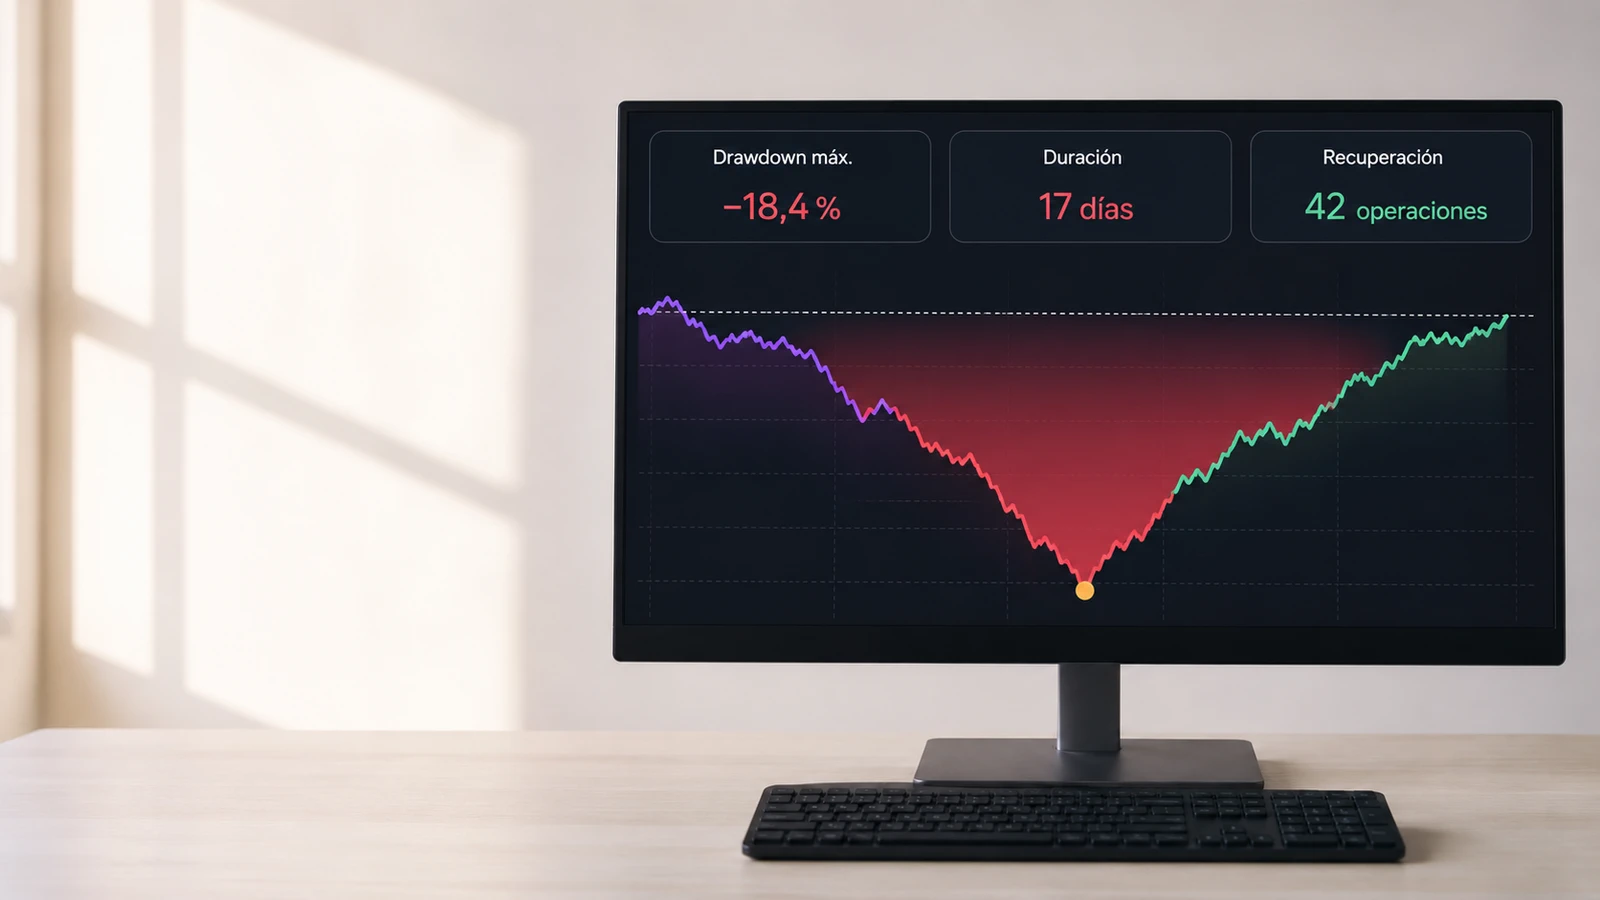
A strategy can finish a period in profit and still have gone through a decline that was difficult to sustain. The final result tells only part of the story; drawdown shows what happened along the way: how far capital moved below its latest peak, how long that phase lasted, and how much work recovery required. Interpreted properly, it is more than a negative percentage: it helps evaluate risk and distinguish an ordinary losing sequence from a change that deserves review.
Drawdown describes an observed decline from a peak; it does not set the worst loss that could occur in the future.
What is drawdown in trading?
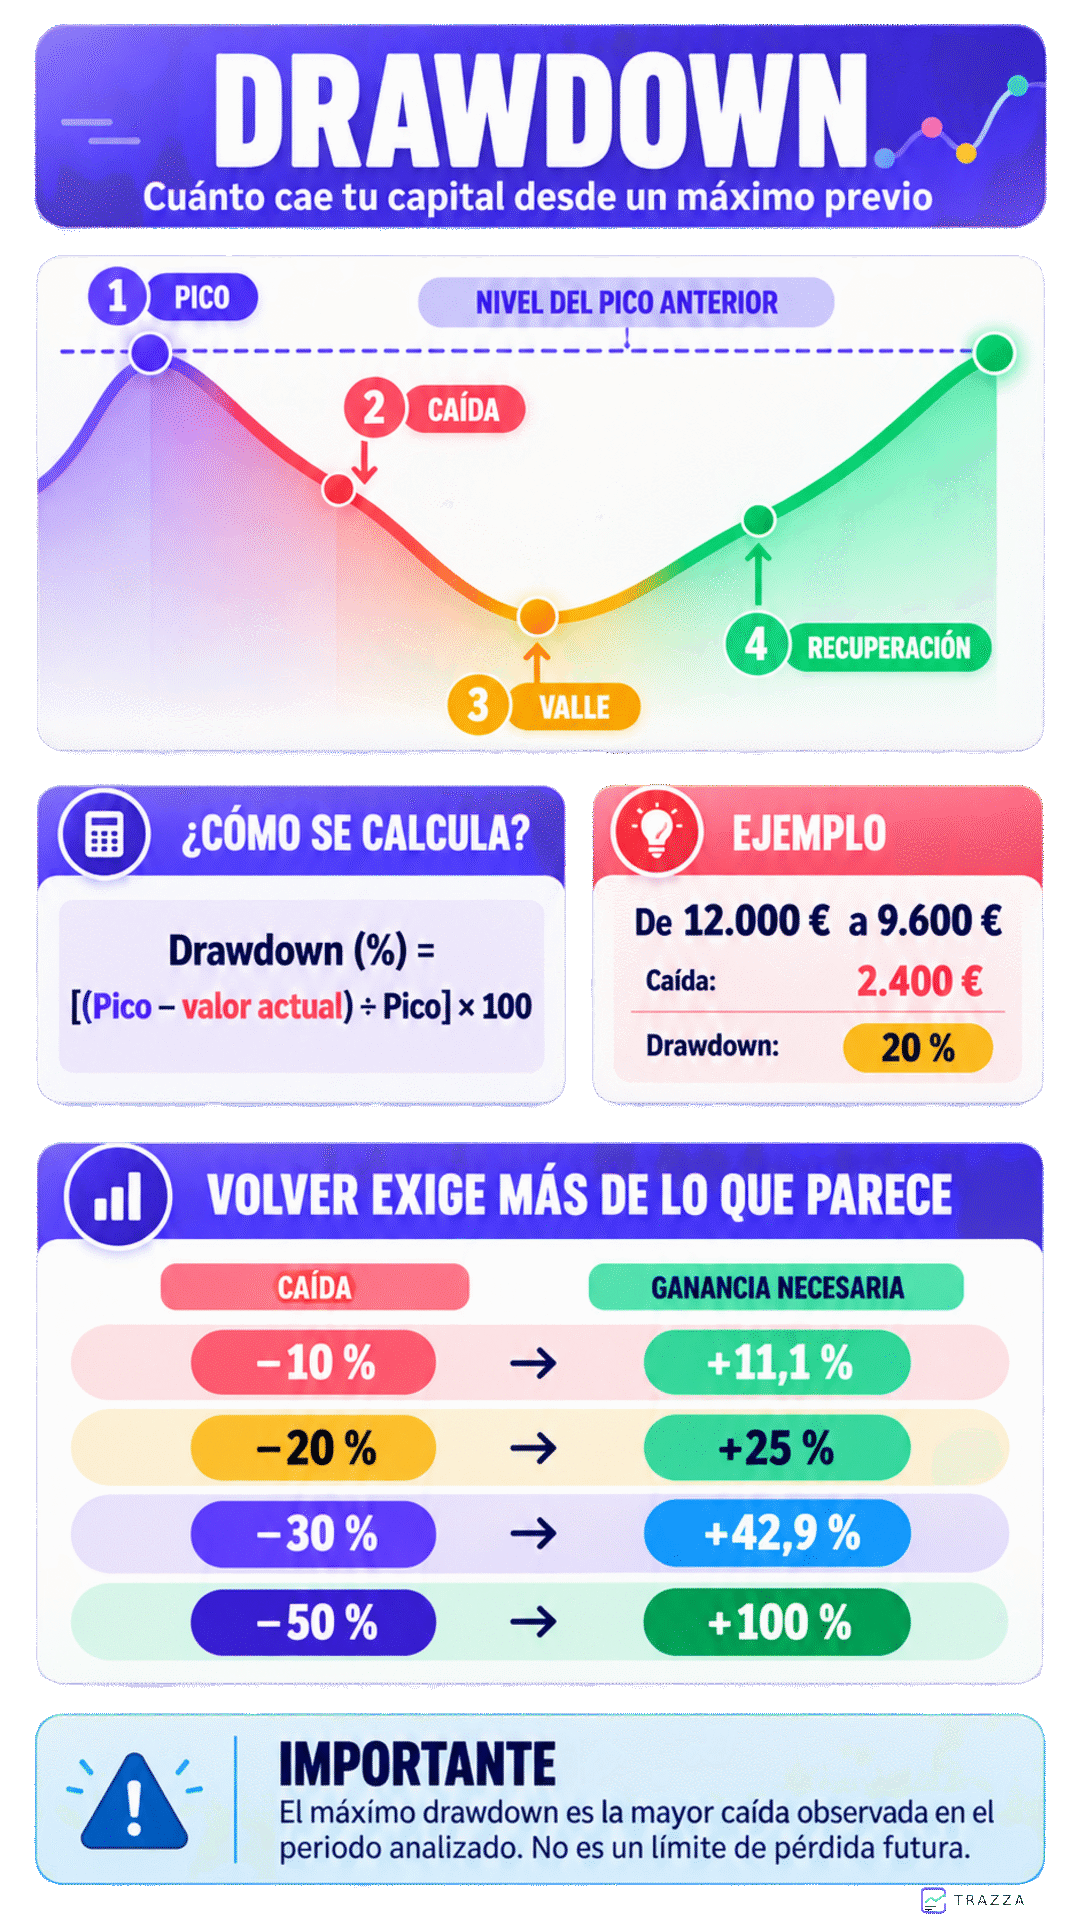
Drawdown is the decline in capital from a previous peak to a lower value reached afterwards. It is measured from that peak, not from the initial deposit or the outcome of a single trade.
A drawdown episode begins when the curve leaves a high and ends when that level is recovered. If the curve then sets a new high, it becomes the reference for subsequent declines.
Maximum drawdown is the largest decline observed within the period and dataset analysed. It is not the worst loss that could occur in the future. It is a historical measurement whose scope depends on the sample and the market conditions included.
It should therefore provide context for position sizing and risk management, not be treated as a promise about a strategy's loss limit.
How to calculate drawdown
The formula uses the previous peak of the curve and its current value, or the lowest value reached during the decline.
Suppose an account reaches €12,000 and then falls to €9,600. The difference from the peak is €2,400 and drawdown is 20%.
If capital rebounds to €10,800, current drawdown becomes 10%, but the maximum for that episode remains 20%. The account is still below the peak until it returns to €12,000.
Some tools use a negative sign, while others display the magnitude as a positive percentage. Either convention works when applied consistently. Comparisons also require the same curve method, currency, fees, and treatment of deposits and withdrawals.
Depth, duration and time underwater
Two 10% drawdowns can be very different: one may occur over three trades and recover the next day; another may continue for months. Three dimensions help describe them.
Duration is not defined identically by every platform. Some include the recovery phase. Separating the decline from total time underwater prevents unlike metrics from being compared under the same label.
A brief but deep decline can suggest concentrated or excessive exposure. A moderate but prolonged one may indicate lower efficiency or fewer opportunities. Neither conclusion is automatic; the trades within the episode provide the necessary context.
Depth
The percentage or monetary distance from peak to trough.
Decline duration
The time from peak to trough.
Time underwater
The full period for which capital remains below the previous high, from leaving it until recovery.
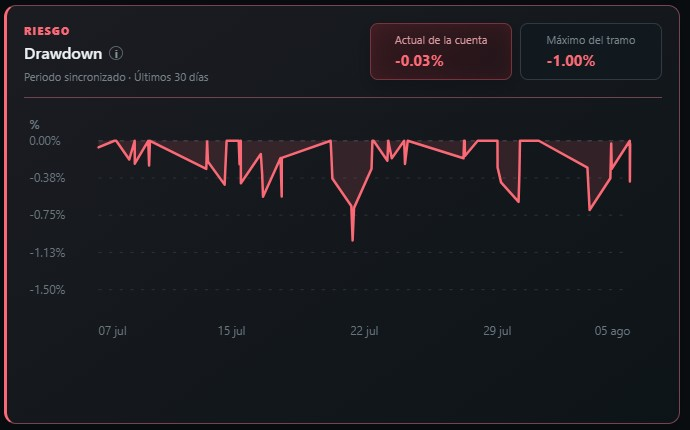
Balance drawdown versus equity drawdown
The result changes with the curve being measured. Balance normally includes trades after they close. Equity also reflects unrealised gains and losses from open positions.
If a trade reaches a €900 unrealised loss but closes at a €250 loss, a closed-trade curve will show €250. An equity curve will also have captured the temporary €900 decline. Both readings are valid, but they answer different questions.
Balance helps analyse realised results. Equity offers a fuller view when positions remain open, entries are scaled, or several assets create simultaneous exposure. Any trading analytics view should state which series it measures and how it handles fees, funding, deposits and withdrawals.
Why recovery requires more than you lost
Loss and recovery are not symmetrical. After a decline, the next gain is calculated on a smaller base. When drawdown is expressed as a decimal, divide it by one minus the drawdown to calculate the required gain.
After falling from €12,000 to €9,600, recovering €2,400 means earning 25% on €9,600, not 20%. After a 50% decline, the remaining capital must double.
This asymmetry is why deep drawdown does more than create discomfort: it reduces recovery capacity and may tempt a trader to increase risk when decision-making is already under pressure.
10% decline
Gain required to return to the peak: 11.1%.
20% decline
Gain required to return to the peak: 25%.
30% decline
Gain required to return to the peak: 42.9%.
50% decline
Gain required to return to the peak: 100%.
What is an acceptable drawdown?
There is no universal percentage. An 8% decline may be excessive for a stable, leveraged strategy; a 15% decline could fall within expectations for a lower-exposure, long-term system.
It must be interpreted alongside risk per trade, volatility, frequency, leverage, position correlation, and the observed loss sequence. The decline a trader can tolerate without abandoning the rules under financial or emotional pressure also matters.
Backtesting with defined rules can provide a historical reference when it includes costs and comparable conditions. It still does not turn the maximum observed into a future ceiling.
The most useful reference compares current behaviour with historical results, the trading plan and limits defined in advance. A decline deserves attention if it exceeds the expected scenario, accelerates, or takes much longer to recover, even when the percentage appears modest.
Sample size limits every conclusion. Maximum drawdown based on 40 trades is less descriptive than one covering several market cycles, and neither guarantees that a larger decline cannot appear.
What drawdown reveals about your trading
The chart shows the symptom; the trades help locate its source. Drawdown may come from normal variability in a positive-expectancy strategy, excessive sizing, overlooked costs, or deteriorating discipline.
If the decline coincides with more FOMO, excessive-risk, or rule-break tags, trading psychology becomes more relevant. If the plan was followed and the distribution remains within expectations, it may be an adverse sequence to manage rather than an immediate reason to discard the method.
Avoid explanations built on tiny samples. A sufficient and comparable sample allows you to form a useful hypothesis and test it against subsequent trades.
- Is the decline concentrated in one setup, instrument, session, or direction?
- Did risk per trade increase?
- Were several positions correlated?
- Did losses follow the plan, or include impulsive entries and early exits?
- Are depth and duration normal, or are they deteriorating?
- Do fees and funding materially change the result?
How to analyse drawdown with TRAZZA
Start by selecting a consistent period and comparing current drawdown with the maximum observed in that range. Then locate the peak, trough and, if it exists, the recovery. The trades between those points form the sample to review.
The line alone cannot explain the cause. Connect it with position size, net result, setup, instrument, time, duration and adherence to the plan.
In TRAZZA, technical, psychological and execution tags allow trades to be segmented. Comparing the period before the decline, the episode itself and the trades that follow helps distinguish a one-off event from progressive deterioration. That is how TRAZZA works: results remain connected to the process that produced them.
Next, write a testable hypothesis: drawdown increased while correlated positions were held, or it lasted longer as one setup produced fewer quality opportunities. Define one action and assess its effect on a new sample.
A weekly trading review helps follow that hypothesis without reacting to every isolated trade.
How to control drawdown without distorting the strategy
The first defence is sizing each position before entry and limiting combined exposure. Daily or weekly limits may also stop risk from escalating, but they should reflect the system's behaviour rather than an arbitrary number.
During a meaningful drawdown, reducing exposure, reviewing execution, and expanding the sample are often more informative than rewriting every rule. Replacing the system after each losing streak prevents you from establishing whether a real problem existed.
Measuring drawdown does not eliminate losses. It shows how much they cost, how long they last and the conditions in which they appear. TRAZZA connects trades, risk, discipline and tags so the outcome remains linked to its origin. To apply this review to your own data, you can request beta access to TRAZZA.
Frequently asked questions
Are drawdown and loss the same thing?+
No. A loss may describe one trade or a defined period. Drawdown measures the cumulative decline from a previous high in the curve and may include several winning and losing trades.
What is maximum drawdown?+
It is the largest peak-to-trough decline observed in the period analysed. It is a historical metric, not an estimate of the worst possible future loss.
How often should I review drawdown?+
It depends on trading frequency. An intraday trader may review it weekly and monthly, while a slower strategy needs longer windows. The priority is to compare consistent periods and avoid reacting to every fluctuation.
Is a 20% drawdown too high?+
There is no context-free answer. Compare it with risk, leverage, volatility, historical sample and personal tolerance. What is certain is that a 20% decline requires a 25% gain to recover the previous peak.
Can a profitable strategy experience drawdown?+
Yes. Even a positive-expectancy strategy goes through losing sequences. The relevant question is whether depth and duration remain compatible with its expected behaviour and predefined limits.